
1-11
Apr 23, 2015

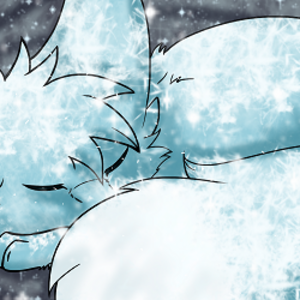
+Look at the chart
The machinery wasn't very helpful. Em moved onto look at the chart.
It was labeled 'Subject 17 Vitality Chart'.
'Average health' and 'Months with Gene Therapy' were the two axes. The points of data measured how healthy the subject was at different points during the tests.
There were no further labels to go off of.
Em couldn't help but wonder what the subjects were, and what had happened to the first 16.
The thought of gene therapy was also puzzling. Wasn't that some kind of procedure to treat disease? Were the subjects diseased? If that was the case then the chart indicated that there was an initial poor reaction, followed by an increase in health and then a relapse.
Whoever the subject had been they'd come awfully close to death more than once during the tests.
And she somehow doubted that the subject had been a labrat. Whatever had been in the tank hadn't been some small animal. And they'd been tested on for almost a year and a half.
Em moved on to look at the tank and the strange green fluid on the floor.
This is an EVENT page. Events are playing out and voting is delayed until previous options have been completed.
Recommendation for you
-

Recommendation
Long Exposure
LGBTQ+ 2.3m likes
-
Recommendation
Vamp Sabbath
Mystery 380.5k likes
-

Recommendation
Heartstopper
LGBTQ+ 6.7m likes
-

Recommendation
Strange and Wild
BL 514.3k likes
-
Recommendation
Humor me
Slice of life 2.8m likes
-
Recommendation
Out of the Blue
Romance 2.4m likes
-

Feeling lucky
Random series you may like
Em
13.2k views107 subscribers
This is a Choose Your Own Adventure series! That is to say, you-the reader- can interact and choose what to do next.
Em has just woken up in a strange dark hallway with no memory and no idea what has happened. All she has are her clothes, and the nametag that is too scuffed to read. The only letter she can make out is 'M'.
YOU get to help decide what Em will do next. Help solve the mystery, help keep her alive, and help regain her memories.
All you need to do is pick one of the four options or suggest your own. Better keep a close eye, this series will update spontaneously and the story will CHANGE according to the choices made. There is no buffer of panels. Each one is made fresh after receiving input from viewers.
(This is both a social experiment and a personal story idea I wanted to test. Your responses WILL be recorded and must be kept PG or PG-13 to be valid.
Choose wisely.)

Comments (0)
See all